Analytic Partners owns decisioning but is nearly silent on AI measurement
SOMIN read 24 months of Business-Owner-directed content from Analytic Partners and three measurement rivals (Nielsen, Kantar and Ekimetrics), cross-checked it against a 7-voice practitioner panel and turned the patterns into three whitespace-backed editorial pillars, a 13-week/39-post calendar and a 108-piece creative library, in days, not weeks.
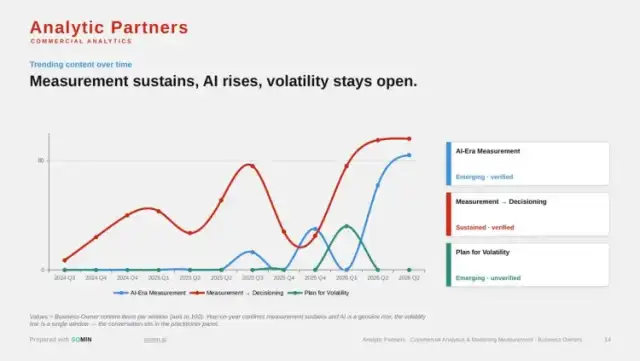 24 months, three converging trends
Business-owner content rose from 7 to 262 items a quarter
Business-Owner content peaked at 262 items in 2026 Q2, up from 7 in 2024 Q3, driven by Measurement → Decisioning, the persistent #1 territory (7→96 a quarter, sustained and verified), and AI-Era Measurement, now the largest late-window theme (0→84, verified; the panel leads it at 44%).
- ✓ Four brands over 12 windows, each checked against the prior year.
- ✓ One persona, The Growth-Accountable Marketing Leader, anchors all 12 windows.
- ✓ AI-Era Measurement is a genuine rise from near zero in the first year.
- ✓ Prove Growth — ROI & Brand×Performance leads live content (35% of the last-90-day competitor set) but is a shared commons, not an AP gap.
Six territories scored for Analytic Partners, three verdicts
SOMIN scored six territories by each brand's share of its own content, cross-checked with the practitioner panel. The clearest three became the pillars.
Attribution → Commercial Decisioning
AP over-indexes its own feed — convert presence into leadership.
AI-Era Measurement & Visibility
The panel leads it at 44% — lead it early.
Plan for Volatility
The panel's #2 theme at 36%, unclaimed by anyone else.
Lower priority: Trust, Sustainability & Representation (AP 13% vs. 5%), a diffuse commons with low fit, and Fragmented Media & Emerging Channels (AP 6% vs. 16%), Nielsen's sports/CTV/retail-media heartland, used only within the Decisioning pillar.
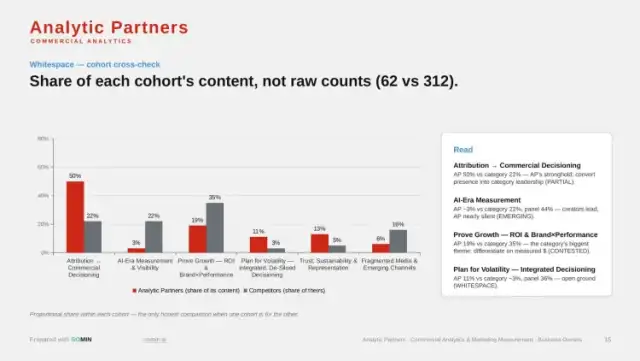
The cohort chart behind these verdicts.
Five layers of SOMIN analysis behind every recommendation
Every recommendation traces back to a SOMIN record, not a guess.
Product
Analytic Partners' GPS Enterprise® (powered by ROI Genome®) against Nielsen, Kantar and Ekimetrics.
Content
One persona → three tensions → three angles → three stories → 21 propositions → a 13-week calendar.
Trend
12 windows over 24 months (Jul 2024–Jul 2026).
Whitespace
Share within each cohort: Analytic Partners n=62, competitors n=312, practitioner panel n=36.
Insights
Fills the calendar; validated against real engagement (8,341 / 8,164 / 9,298).
Three pillars for Analytic Partners, one challenger throughline
Decisioning Beats Measurement
The play — “The Metrics That Bind”: move Analytic Partners from measuring the past to deciding the future. Category content criticises outdated attribution and vanity metrics but stops at what happened. AP already over-indexes here (50% vs. 22%) and can make “Commercial Decisioning” the category's term.
Measure the AI You Can't See
The play — “Simplicity Cuts Through the Noise”: AI now shapes demand between brands and buyers that traditional attribution never sees. It is the panel's #1 theme (44%) and Kantar-led (22%), while AP is nearly silent (~3%) but can still lead.
Plan for the Shock
The play — “Breaking the Mold”: static annual plans and siloed teams break when conditions change (energy shocks, tariffs, demand swings). It is the panel's #2 theme (36%), owned by neither AP (11%) nor competitors (~3%): the cleanest open territory, and a chance to reframe AP as an operating system for decisions.
Three moves for Analytic Partners over the next two quarters
Own “decisioning”, not “measurement”. AP already leads this conversation (50% vs. 22%); reframe every asset around deciding the future.
Claim AI-era measurement first. The panel and Kantar lead it (44% / 22%) while AP is nearly silent (~3%); publish the ROI Genome®-quantified answer now.
Lead on “plan for volatility”. No one owns always-on decisioning for shocks (panel 36%, AP 11%, competitors ~3%); use GPS Enterprise® scenario planning and the +$75M reallocation proof.
Analytic Partners creatives by insight chain
Choose a chain. The awareness, consideration and conversion lines from that chain appear together.
Analytic Partners case study FAQ
What is a SOMIN cross-market briefing?
How does SOMIN measure content whitespace against competitors?
What is the 'five layers' SOMIN analysis engine?
What's included in the briefing's calendar/content recommendations?
How long does this kind of briefing take to build?
SOMIN is a Singapore deep-tech platform that turns real-time competitor and audience intelligence into market-ready creative ideas, typically 13× faster than manual research. Clients include P&G, Audi, Ferrari, Gojek, Abbott, Citi, KFC, Nestlé and McDonald's in 11+ markets; agency partners include Dentsu, OMG, GroupM, Havas and Publicis.
Built by seasoned marketers and an AI professor: the methods behind this study are peer-reviewed at AAAI, ACM Multimedia, SIGIR, WSDM and in ACM TOIS. See the research and talks.
Get the full Analytic Partners case study
The full PDF adds the full charts, all 21 propositions, the 39-post calendar and the 108-piece library.
Free PDF · No spam · Takes 15 seconds